
 forecast and analysis on September 13, 2017")
Cryptocurrency Ethereum (ETH/USD) is trading at 301.41. Quotes of the pair are traded below the moving average with a period of 55, indicating a bearish trend along the Ethereum/Dollar. At the moment, the quotes of the pair are testing the average border of the bands of the Bollinger Bands indicator. An insignificant correction is expected near the level of 312.70, from which one should expect an attempt to continue the fall and further development of a downward trend with a target near the level of 255.50.
Ethereum (ETH/USD) forecast and analysis on September 13, 2017
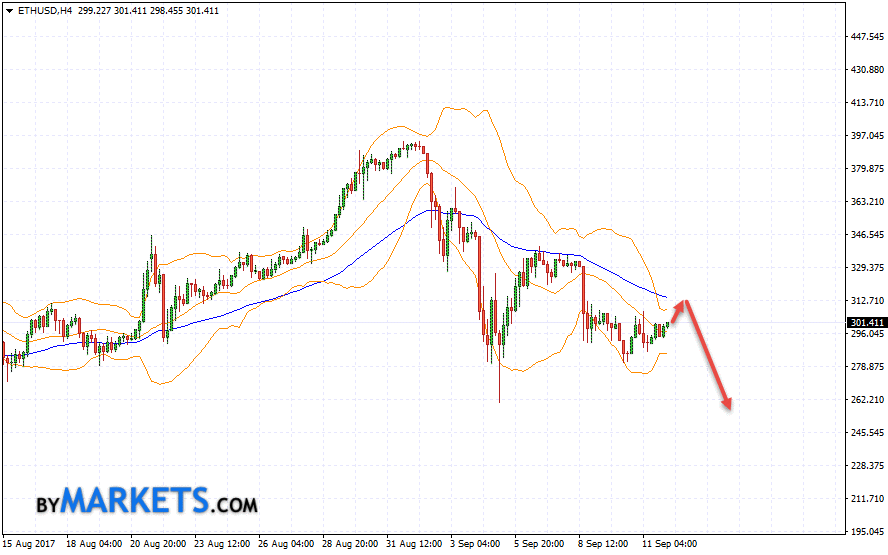
The conservative sales area is located near the upper boundary of the Bollinger Bands indicator bars at 308.20. The abolition of the continuation of the fall of the Ethereum/Dollar pair will be a breakdown of the upper border of the Bollinger Bands indicator bands, as well as a moving average with a period of 55 and the closing of the pair quotes above the area of 320.50, indicating a change in the trend in favor of the bullish ETH/USD. In the event of a breakdown of the lower boundary of the bands of the Bollinger Bands indicator, it is expected to accelerate the fall.


