
 forecast and analysis on January 15, 2019")
Cryptocurrency Ripple (XRP/USD) is trading at 0.3209. Cryptocurrency quotes are trading below the moving average with a period of 55. This indicates a bearish trend on Ripple. At the moment, cryptocurrency quotes are moving near the lower border of the Bollinger Bands indicator bands.
Ripple (XRP/USD) forecast and analysis on January 15, 2019
As part of the Ripple course forecast, a test level of 0.3280 is expected. Where should we expect an attempt to continue the fall of XRP/USD and the further development of the downward trend. The purpose of this movement is the area near the level of 0.2970. The conservative sales area for Ripple is located near the upper border of the Bollinger Bands indicator at 0.3370.
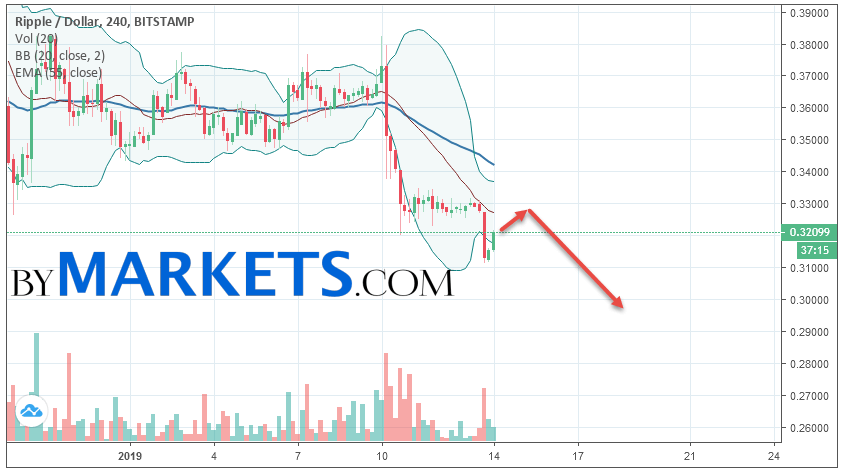
Cancellation of the option to continue the decline in Ripple will be the breakdown of the upper border of the Bollinger Bands indicator bands. As well as a moving average with a period of 55 and closing quotations of the pair above the 0.3520 area. This will indicate a change in the current trend in favor of the bullish for XRP/USD. In the event of a breakdown of the lower border of the Bollinger Bands indicator bands, one should expect an acceleration of the fall of the cryptocurrency.
Ripple (XRP/USD) forecast and analysis on January 15, 2019 implies a test level of 0.3280. Further, it is expected to continue falling to the area below the level of 0.2970. The conservative area for selling Ripple is located area of 0.3370. Cancellation of the fall of the cryptocurrency will be the breakdown level of 0.3520. In this case, we can expect continued growth.


